THE PROBLEM
Dashboards show numbers. They rarely explain them.
Most BI tools stop at the chart. Understanding whether a metric's move is a real trend or noise, and what to do about it, is still left entirely to the person staring at it.
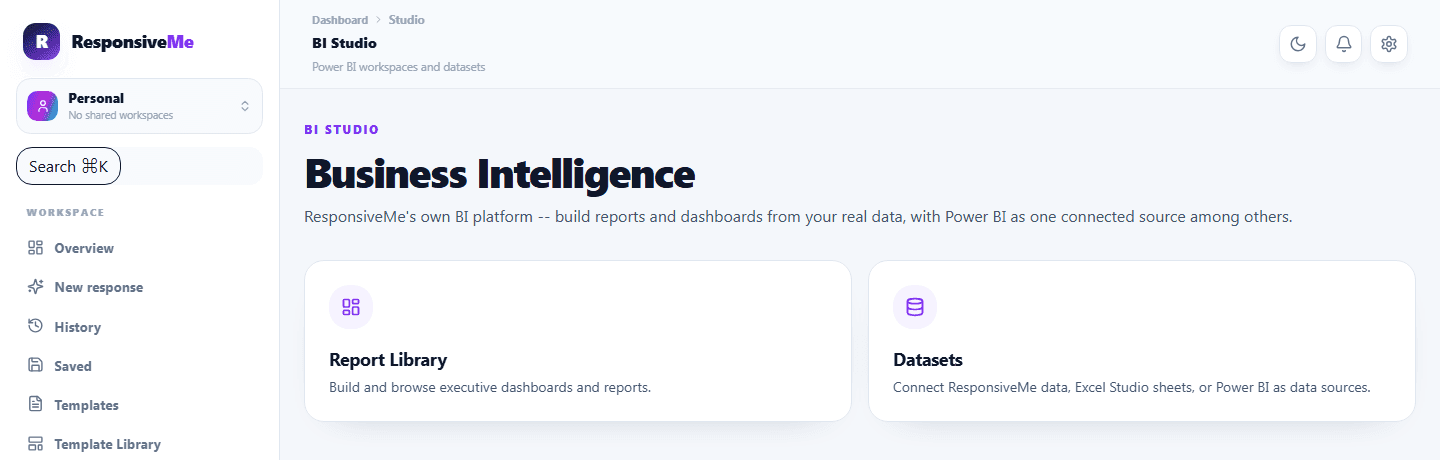
BI Studio brings your internal metrics, Excel Studio workbooks, and Power BI datasets into one reporting workspace — with AI that narrates trends and anomalies using real computed statistics.
Dataset
Trend
AI insight
THE PROBLEM
Most BI tools stop at the chart. Understanding whether a metric's move is a real trend or noise, and what to do about it, is still left entirely to the person staring at it.
THE RESPONSIVEME APPROACH
Trend direction and anomaly detection are computed as plain statistics — the same with or without AI. An optional AI layer then turns those facts into an executive summary and recommendations, so the narration is always grounded in real numbers, never invented ones.
WHY IT MATTERS
Arrange widgets on a real dashboard canvas — resize, rearrange, and save the layout.
Report on ResponsiveMe's own internal data, Excel Studio workbooks, or an existing Power BI dataset — side by side.
Recent-vs-prior-period trend comparisons are computed statistically, not guessed by a language model.
Outliers are flagged using standard statistical thresholds, so unusual data points don't get lost in a chart.
Natural-language queries are matched to a fixed, safe catalog of metrics — never an open-ended query against your data.
Widgets recompute from the live source every time you view them, and you can restore an earlier version of a report whenever you need to.
HOW IT WORKS
Internal ResponsiveMe data, an Excel Studio workbook, or a connected Power BI dataset.
Arrange KPI, chart, and table widgets on a real canvas — resize, rearrange, and save the layout.
Statistically — the same recent-vs-prior comparison and outlier detection with or without AI.
An executive summary grounded in the real computed numbers — never invented ones.
Widgets pull from the live source each time you open the report, with version history to go back.
USE CASES
A weekly dashboard summarizing what changed, with an AI-written summary a leader can read in 30 seconds.
Track automation success rates, response volume, and usage against plan limits in one place.
Bring an existing Power BI dataset into the same workspace as your ResponsiveMe and Excel Studio data.
Connect a data source and get an AI-narrated report in minutes.